By: Mikko Nassi Updated: April 2012.
You are on page one of this 4-page introduction to karting data acquisition.
Introduction | Choosing a System | Software Comparison | Prices and Conclusion
Getting Started with Kart Data Logging
This article covers the basics of kart data acquisition/data logging (why use it and what for), and goes over what karters should consider when purchasing their first data logging system. A large emphasis is placed on comparing the available systems. I won’t go into much detail about actually analyzing the data.
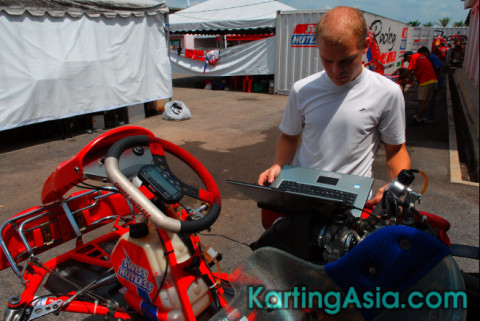
At almost any kart meeting you’ll notice that almost all the drivers have a digital dash on their steering wheel which typically shows them at least their lap times, their RPM (Engine Revolutions Per Minute), and an engine temperature (water or cylinder head).
You might feel that it’s a waste of money spending hundreds or thousands (depends on your currency really) on a timing system when you can have your mate time you with a stopwatch. The reason that so many people spend money on these systems is that even when used only to view lap times drivers already gain valuable feedback on their driving. When used to the maximum a data logging system can potentially improve your performance every single time you download and analyze the data!
Additionally other than improving performance a system can potentially save you money warning you of an imminent engine failure – if you see your temperature reading going excessively high you know something is wrong. More than a few engines have been saved when a water hose has come loose or a radiator has broken and the driver has been warned by his onboard dash.
Hopefully that’s already given you enough incentive to consider a data logging system if you don’t have one yet…
What does a data logging system consist of?
A basic entry level data-logging system usually records your laptimes, engine RPM, and engine temperature (water or cylinder head). These basic features can get you quite far already in data analysis, especially if you are able to download the data and review it on a laptop on the software provided with the logger.
The next options usually include a wheel speed sensor and a g-force sensor which are very useful tools in data analysis.
And some even more advanced sensor options available:
- Additional wheel speed
- Exhaust Gas Temperature/Lambda
- GPS
- Throttle
- Brake
- Steering
- Tire Temperature
- Tire Pressure
- Power Valve
What are data loggers used for?
The most obvious benefit of using an onboard display is that it provides the driver with instant feedback on their kart and their driving. On the track the driver will receive instant feedback on his laptimes and will know immediately if a change in setup or driving has improved his laptime.
The driver will also know if there is something wrong with his engine or if he’s running the wrong gearing. If the temperature rises above normal levels he might be alerted to a broken water pump for example which otherwise could’ve resulted in an expensive engine repair bill. With the RPM information a driver will also know if he has gone out with too tall a gearing for example – he will be able to see instantly if he is over-revving the engine at the end of the straight and he can pit to change his gearing and save the engine.
Now that is only what the driver can see on the display when out on the track – with the data logging capabilities there is a lot more to be gained. The onboard systems aren’t only able to constantly display this information to the driver – but they are also able to constantly record this data (duh, that’s why they’re called data loggers).
Most karting data acquisitions systems log data at a rate of 10Hz (10 Hertz), which simply means that they are capable of recording data 10 times per second. This means that with the assistance of software to interpret the data you can plot graphs that display RPM or other values during your lap for every 10th of a second. The PI Research kart system has logging capabilities at 50Hz (50 times per second), which largely justifies its much higher price. You have to be very experienced to be able to take advantage of the added capabilities of the PI system.
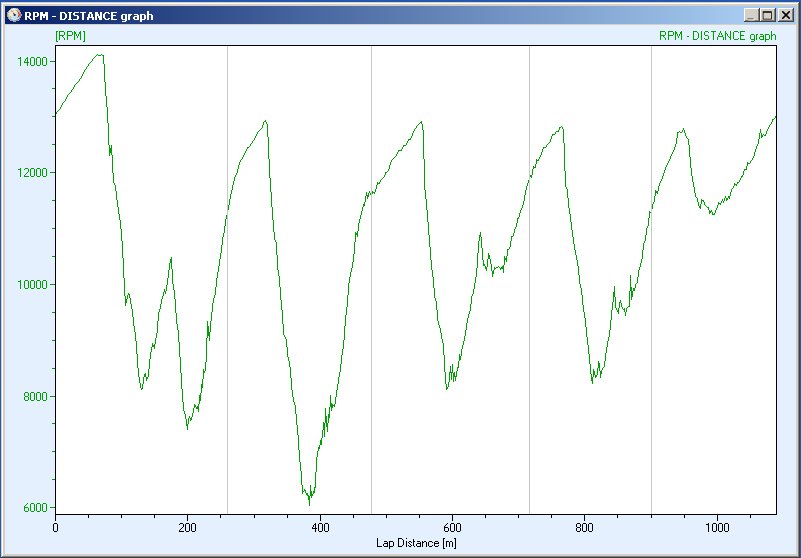
The real beauty of data logging comes in comparing your data from one lap to another by overlaying the different laps’ data on the same graph. With just the RPM data you are able to see where you lost time and where you gained it. After a driving-style or setup adjustment you can review the data to see where it helped you gain time – or where it went wrong.
Even better for driver improvement is comparing your lap to that of another driver on similar equipment. This is where the real gains are to be made especially for new drivers if you are able to find an experienced driver’s data to compare to. It will instantly become apparent where you are losing most of the time from driving technique and you can then focus on those sections by observing him on track to see what the faster driver is doing differently.
Next Page: Available Logging Systems